Introduction
Gait analysis is a scientific method of evaluating movement patterns, kinesiology and examining the range of joint movement and muscle function during walking. Gait analysis is used to assess, plan, and improve the movement patterns of people with disabilities. Rehabilitation movement specialists and physiotherapists use this method to analyze the movements of professional athletes and their injured clients. This type of kinesiology can be effective for analyzing injuries in the skeletal and muscular structure, and professional experts can prepare more suitable movement programs and exercises for their clients.
Parameters that can be extracted from graphs
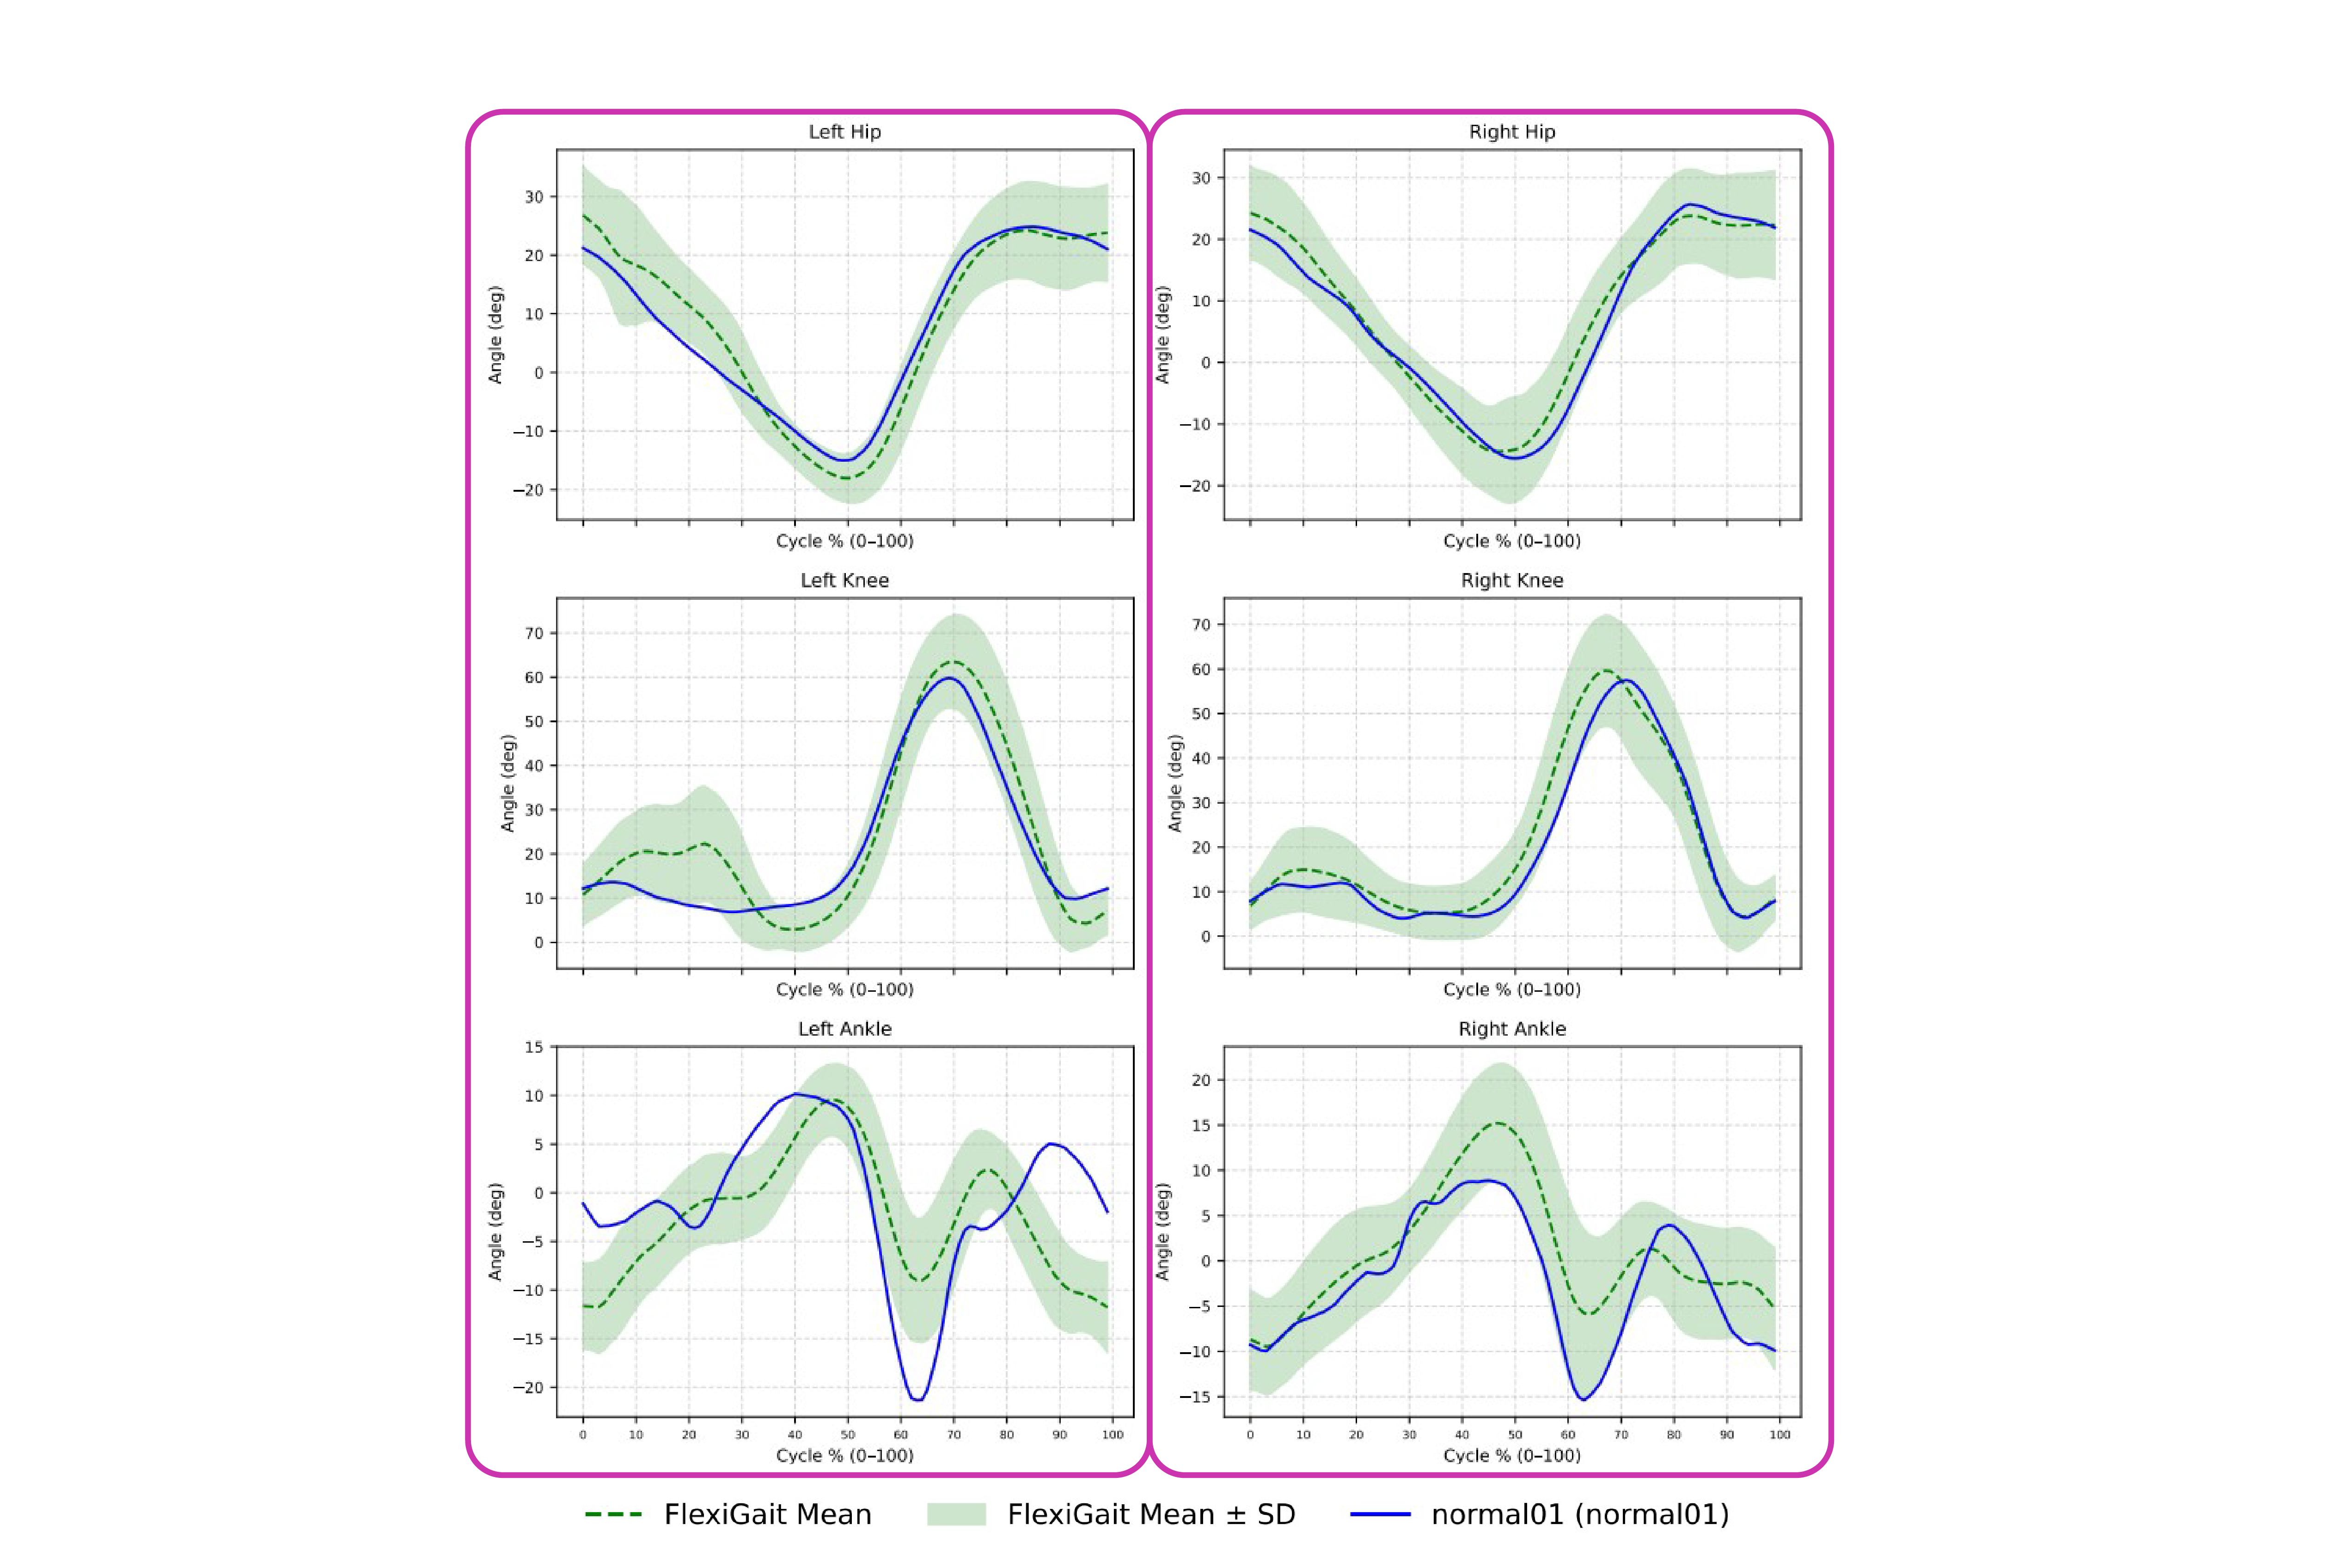
In this section, a number of parameters related to gait analysis and related graphs from the FlexiTrace application are examined. These graphs show the changes in the hip, knee and ankle angles in the sagittal plane, with positive values indicating hip flexion and knee flexion and negative values indicating hip extension and knee extension. Also, positive values for the knee angle indicate dorsiflexion and negative values indicate planter flexion.
• Extension is a movement that increases the angle between two body parts and usually results in a straightening of the joint.
• Flexion is a movement that decreases the angle between two body parts and usually results in a bending of the joint.
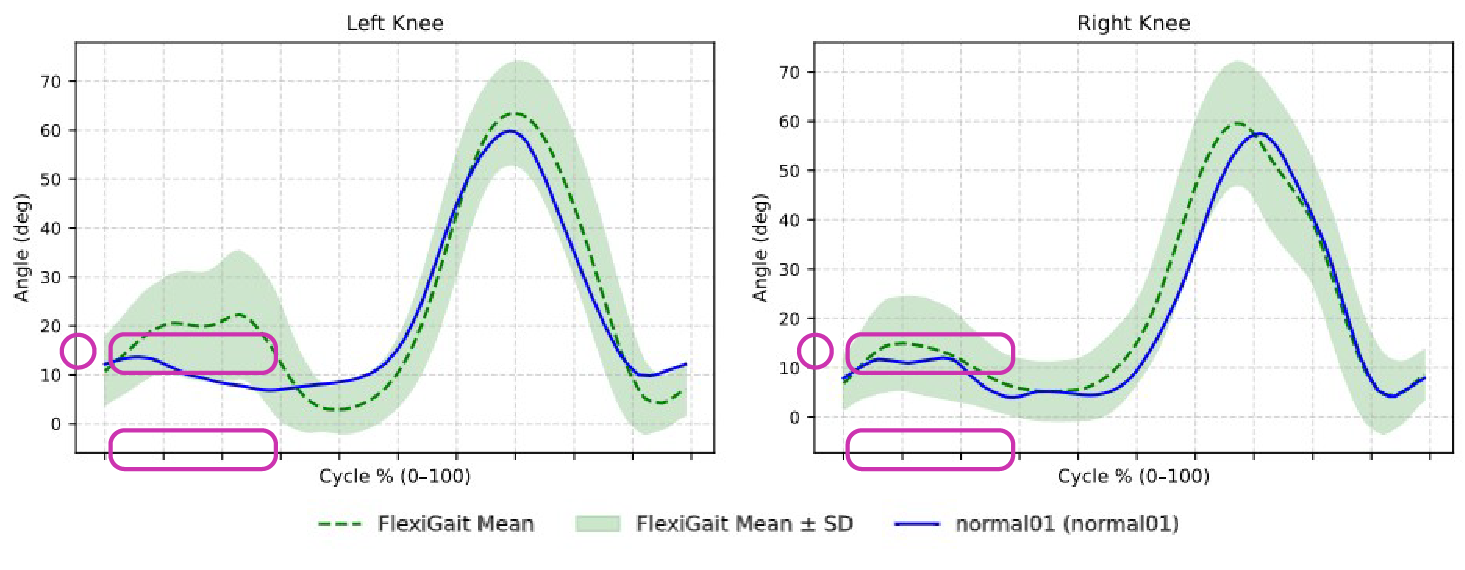
1. The maximum knee angle in the stationary phase: for the attached video, the value of this angle in different periods of walking for the left and right leg is about 10-15 degrees, and these values occur at the end of the stationary phase, that is, 20% of the entire cycle.
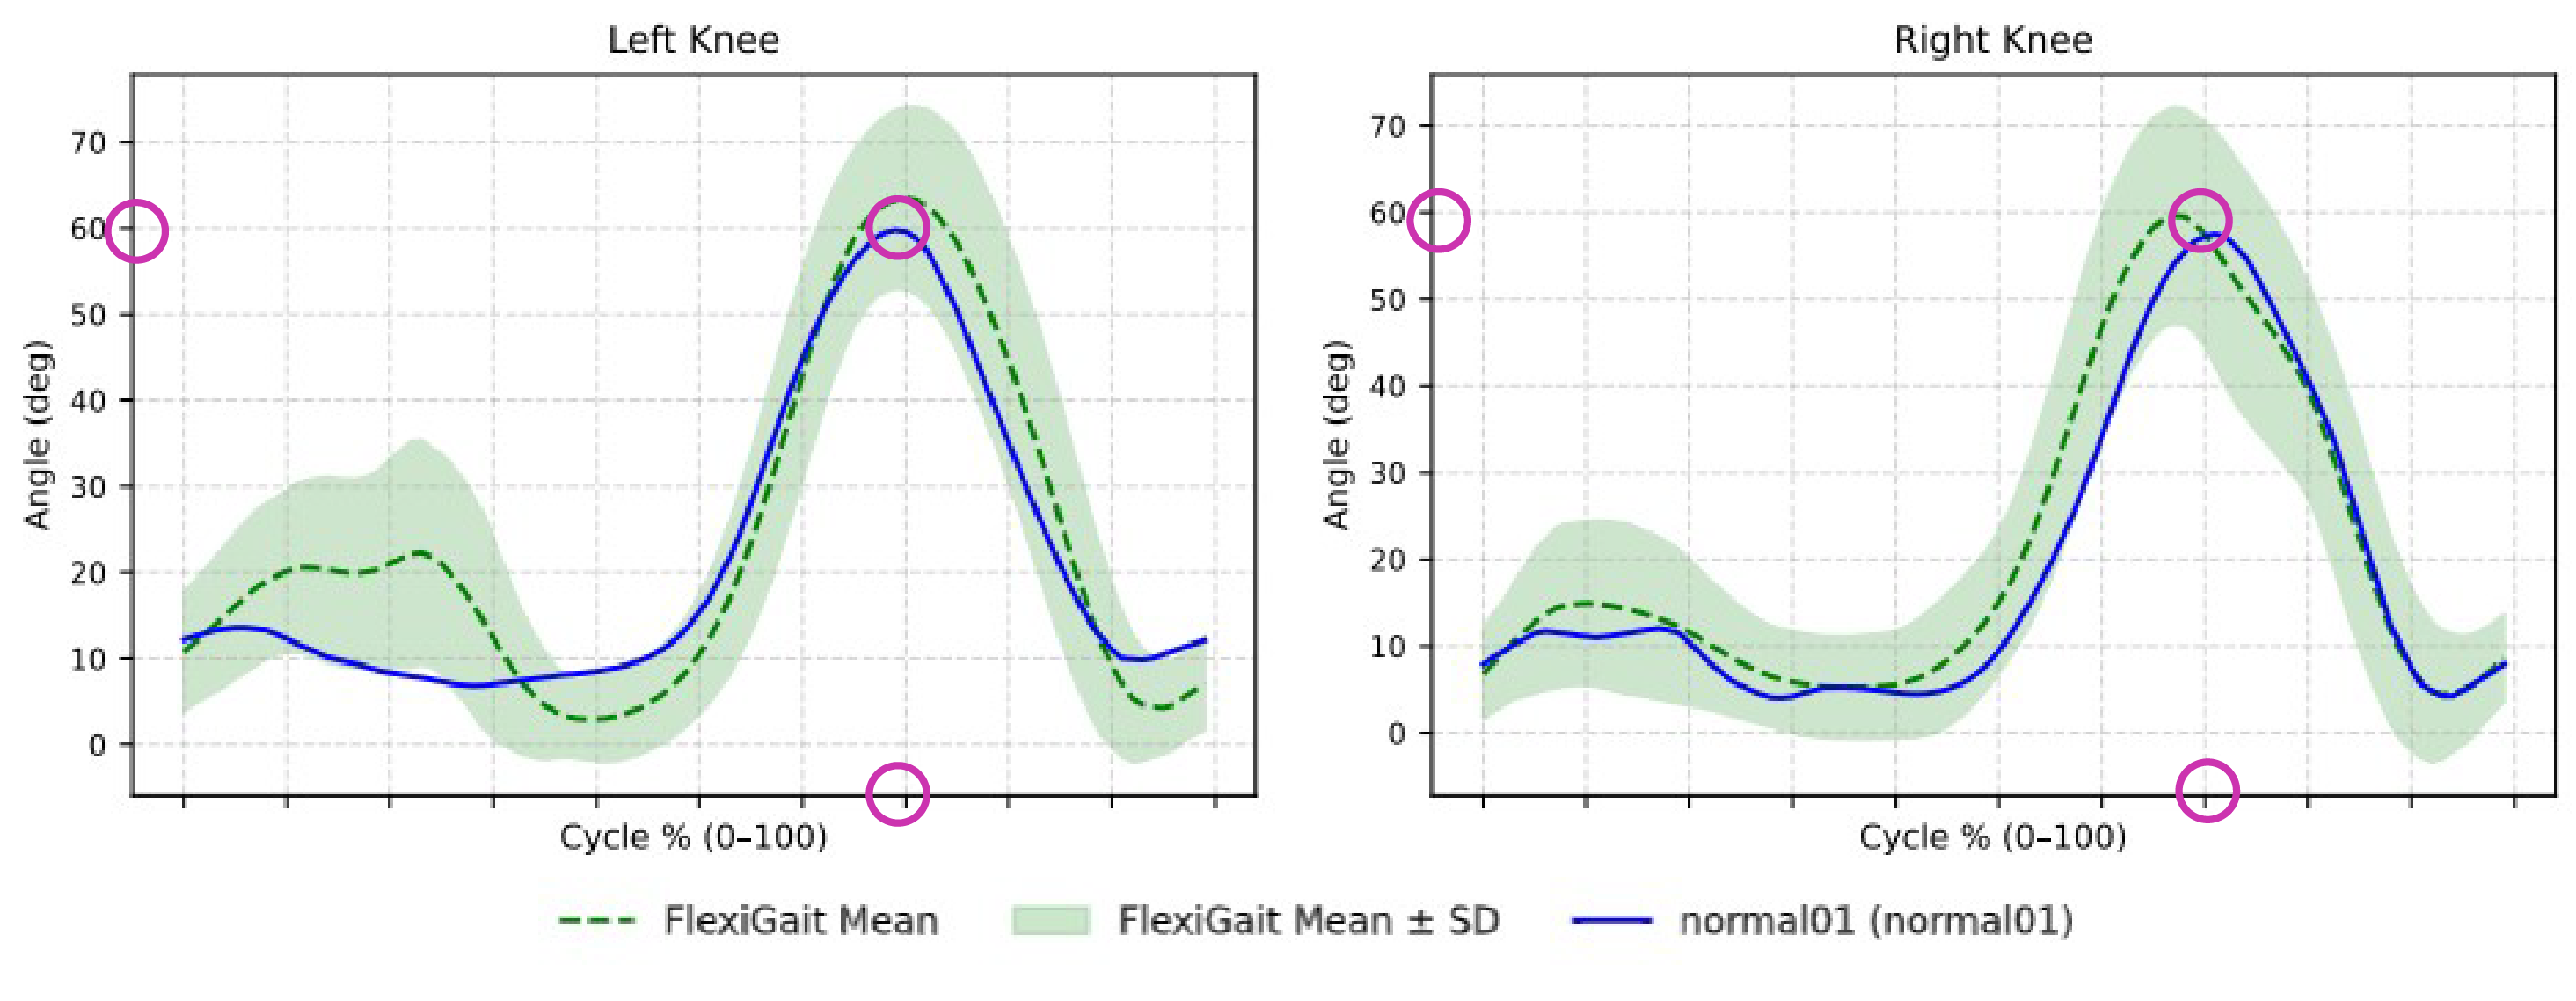
2. The maximum knee angle in the swing phase: the value of this angle in different periods of walking for the left and right leg is about 60 degrees, and these values occur in the beginning of the swing phase, that is, about 65% of the cycles.
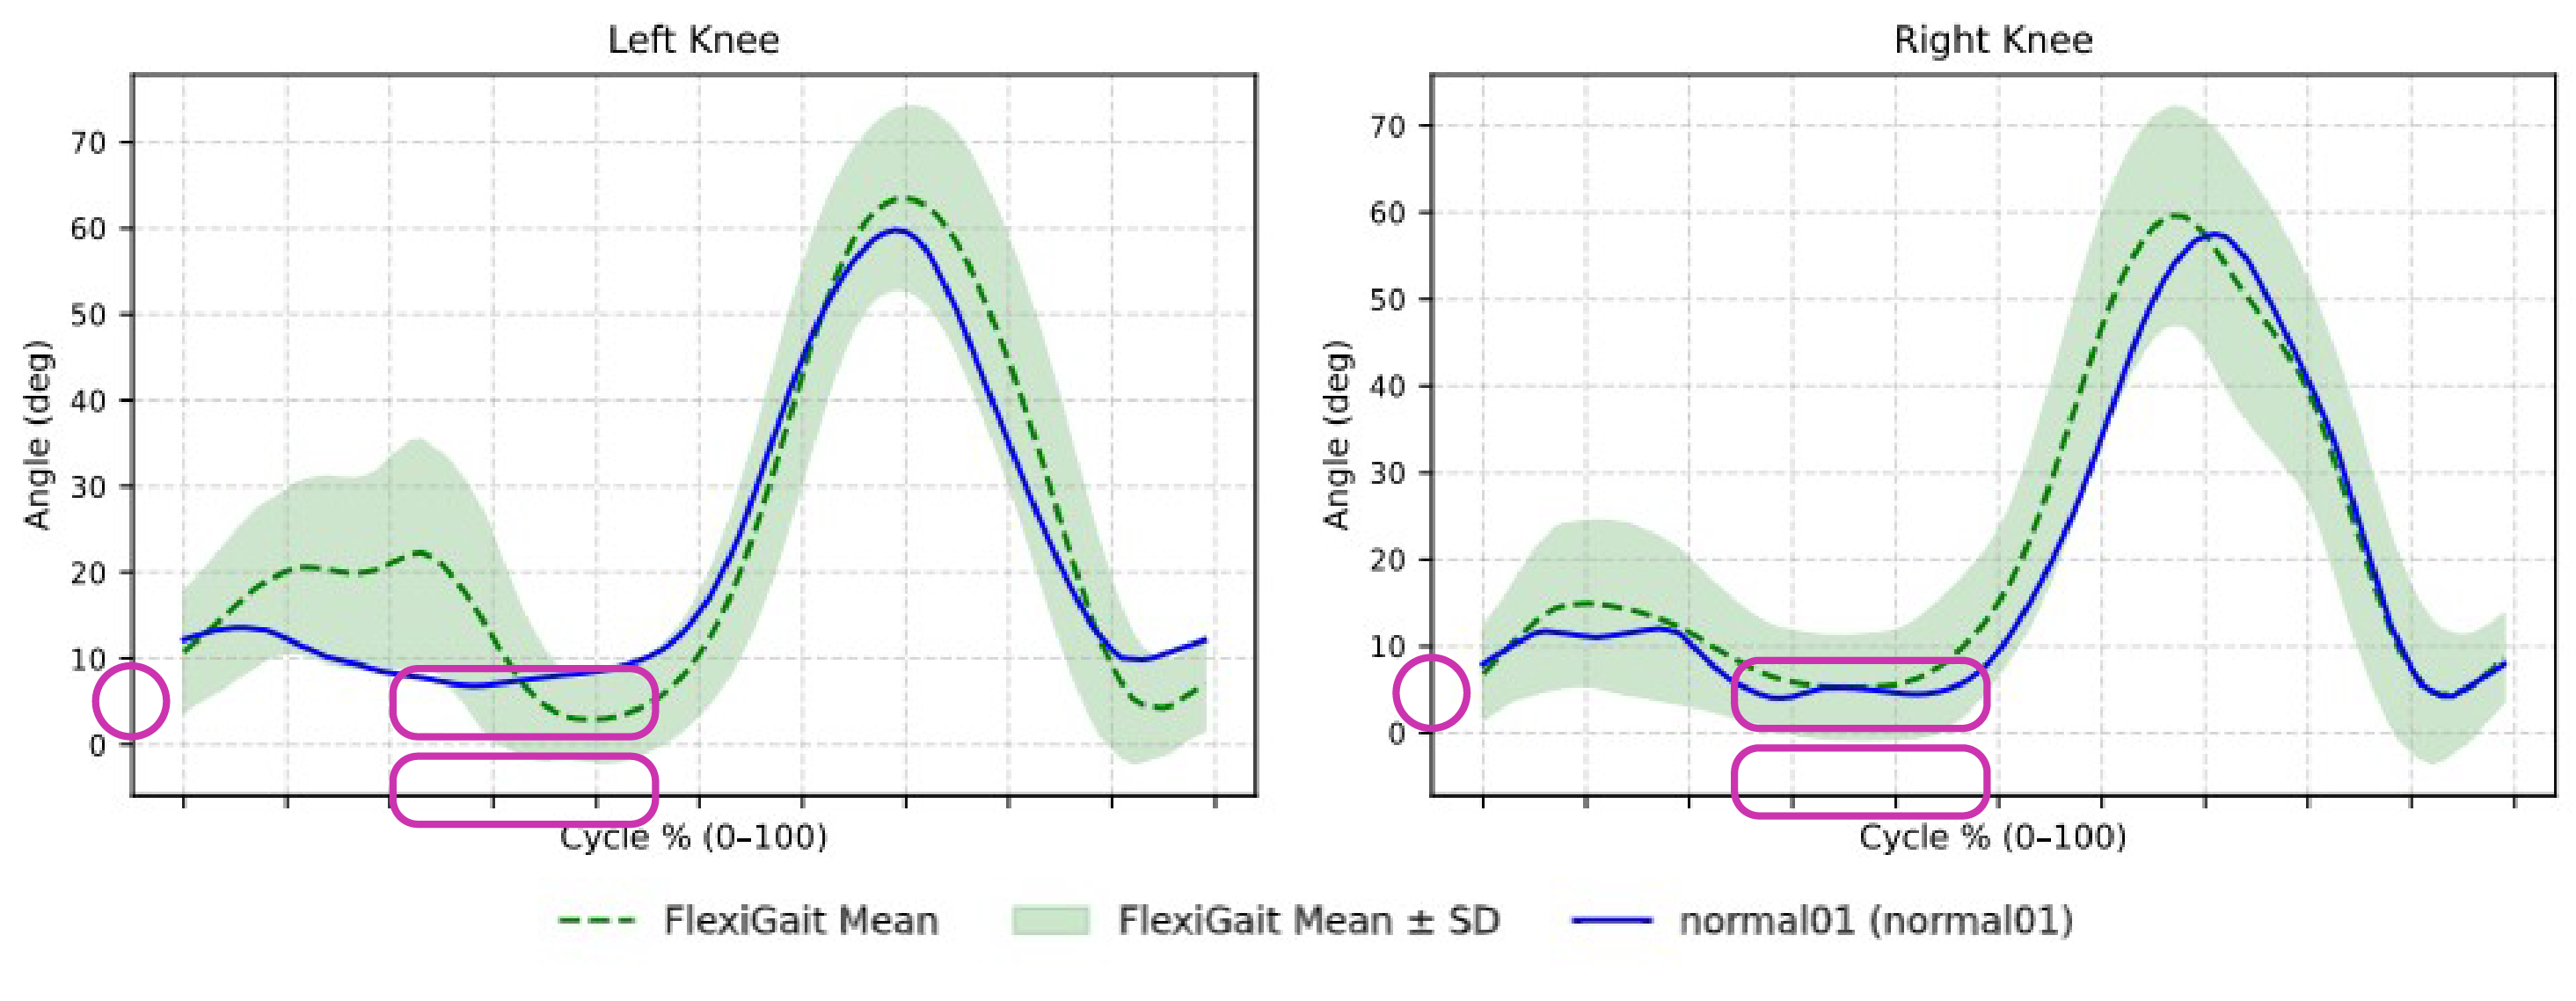
3. The minimum knee angle in the stationary phase: for the attached video, the value of this angle in different periods of walking is about 0-10 degrees, which can be seen in the range of 20-50% of each cycle.
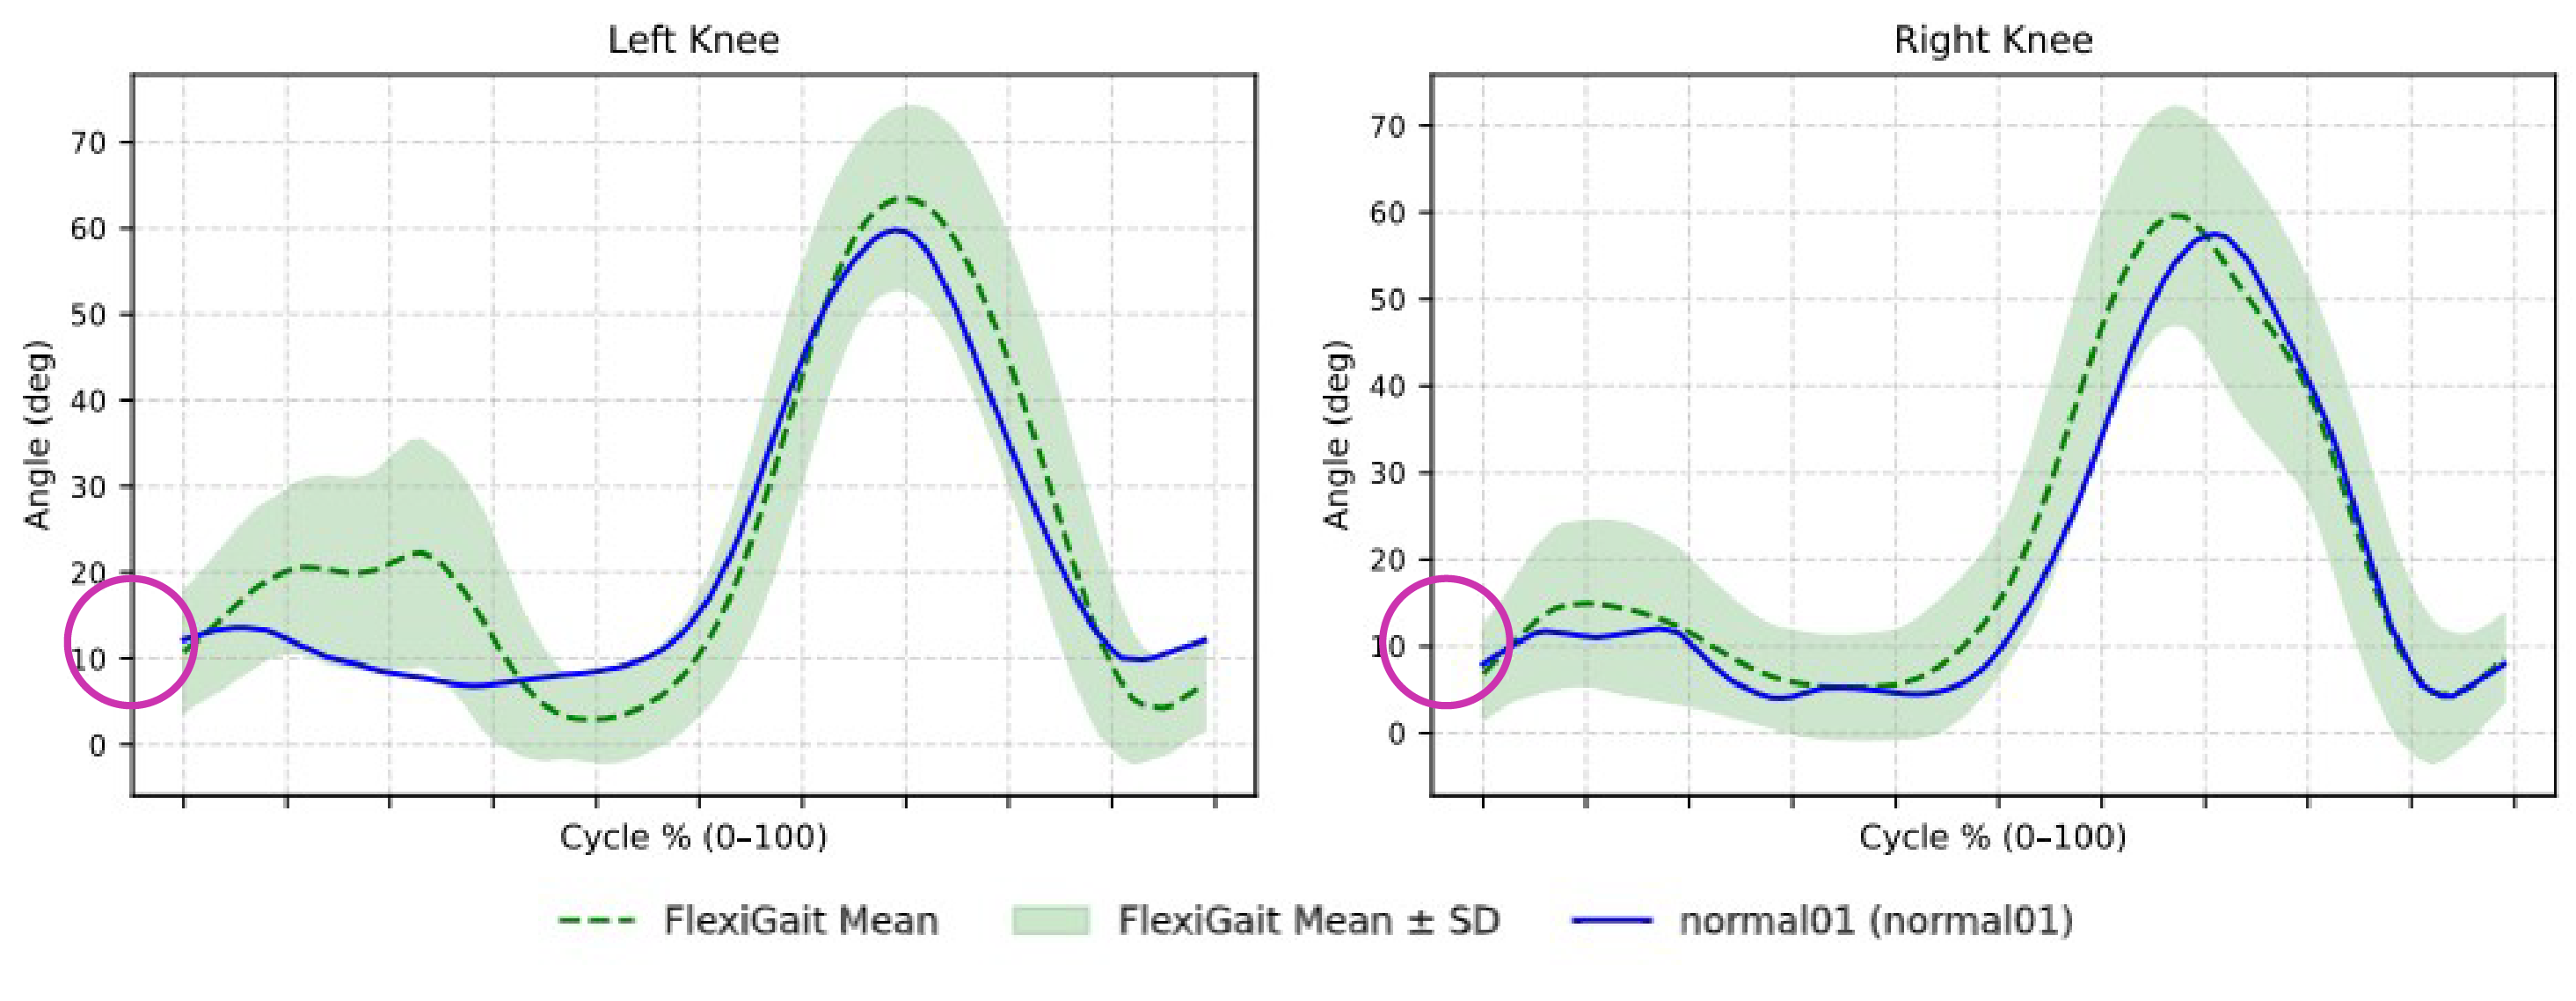
4. The value of the knee angle at the moment of the start of the cycle: for the attached video, the value of this angle in different periods of walking for the left and right leg is about 15 degrees, respectively.
5. Minimum hip angle: The minimum value of the hip angle in different periods of walking is about -15 degrees and can be seen in about 50% of each cycle, which shows the maximum amount of extension of this joint.
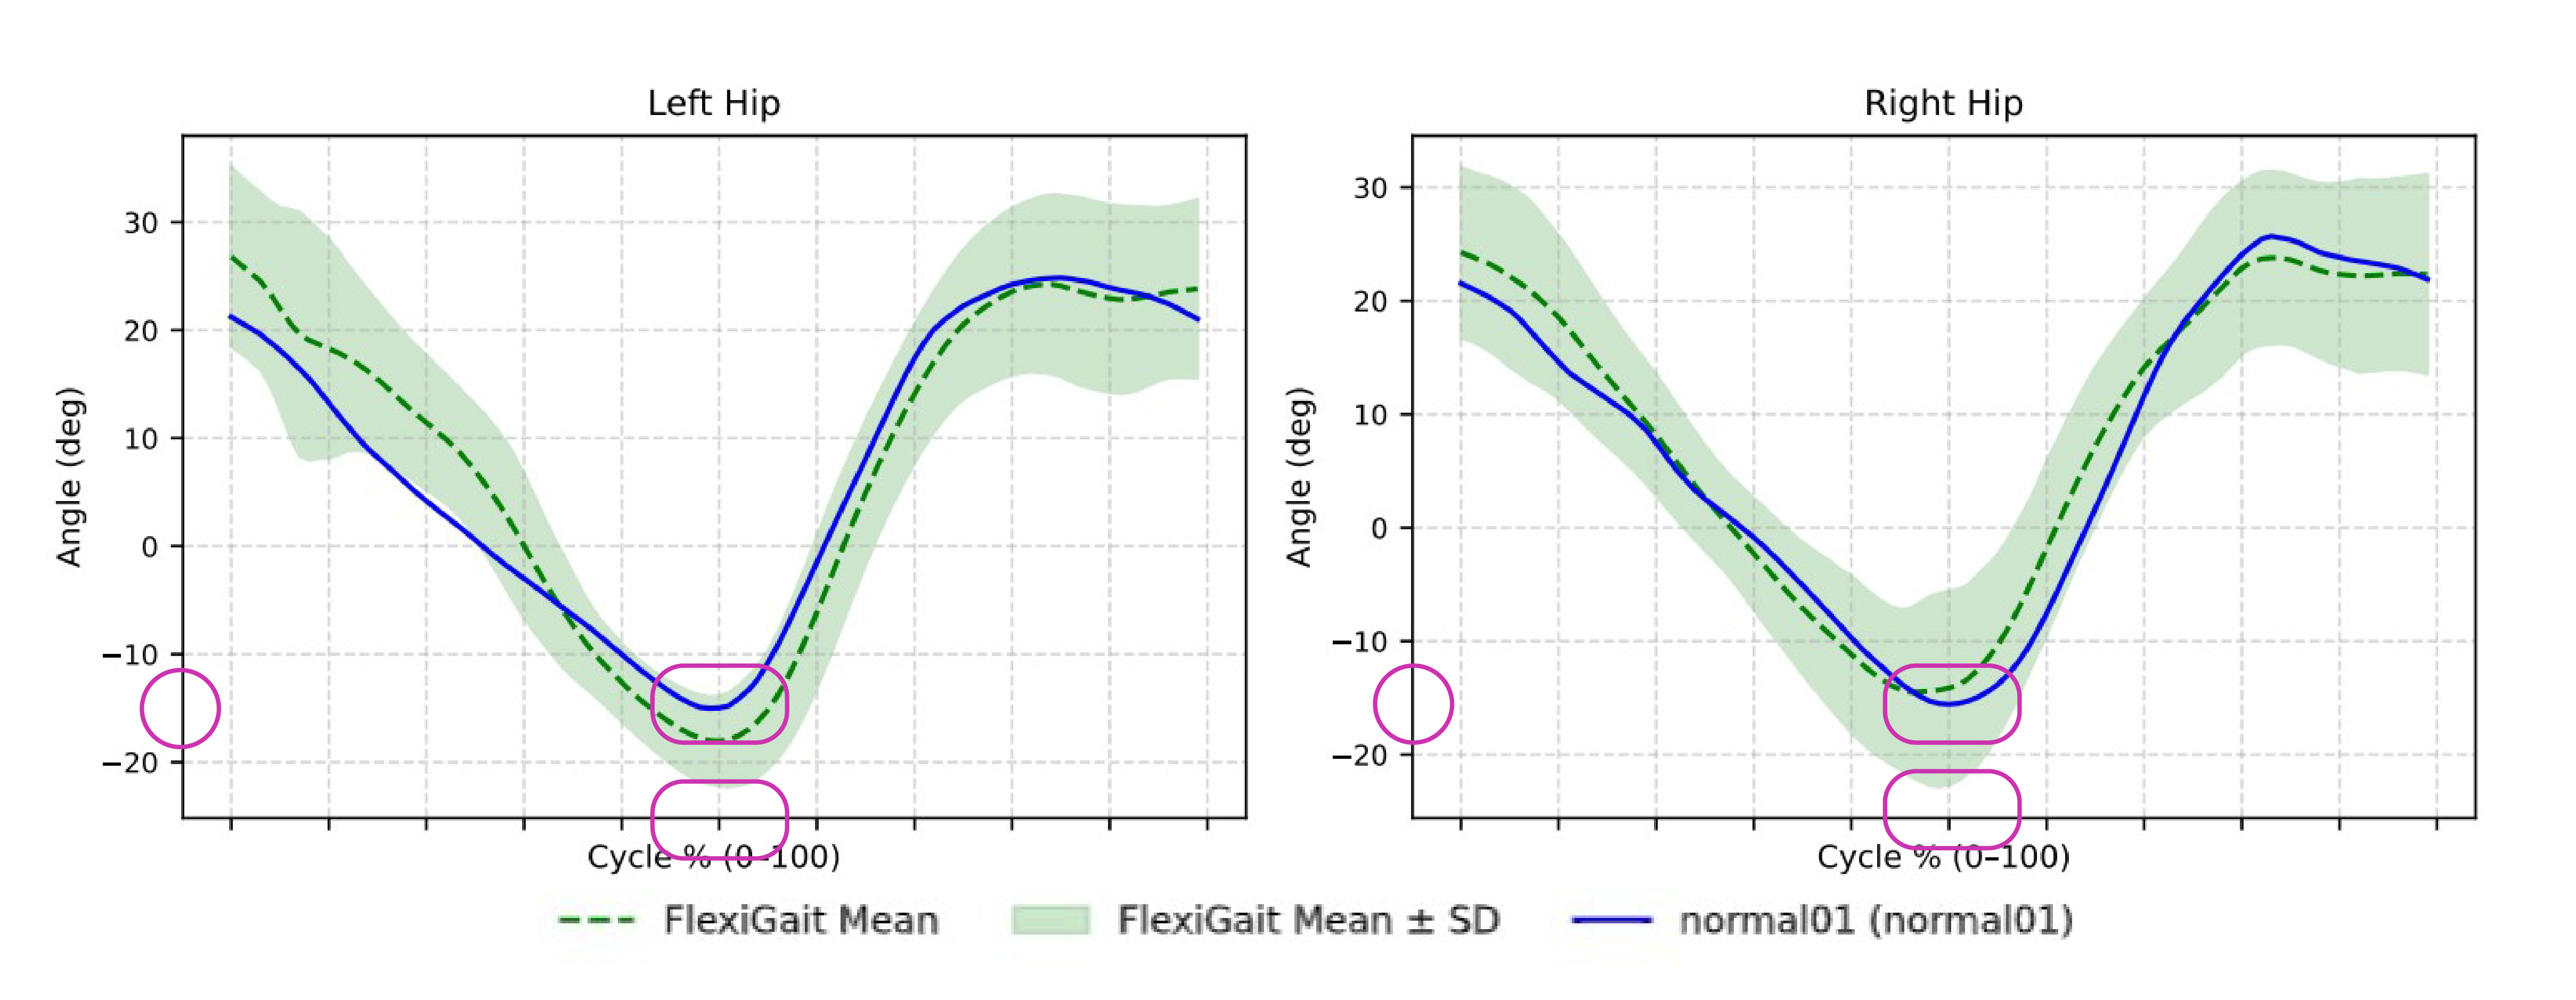
6. The maximum value of the hip angle: the value of this angle in different periods of walking is about 25 degrees, which shows the maximum amount of flexion of this joint.
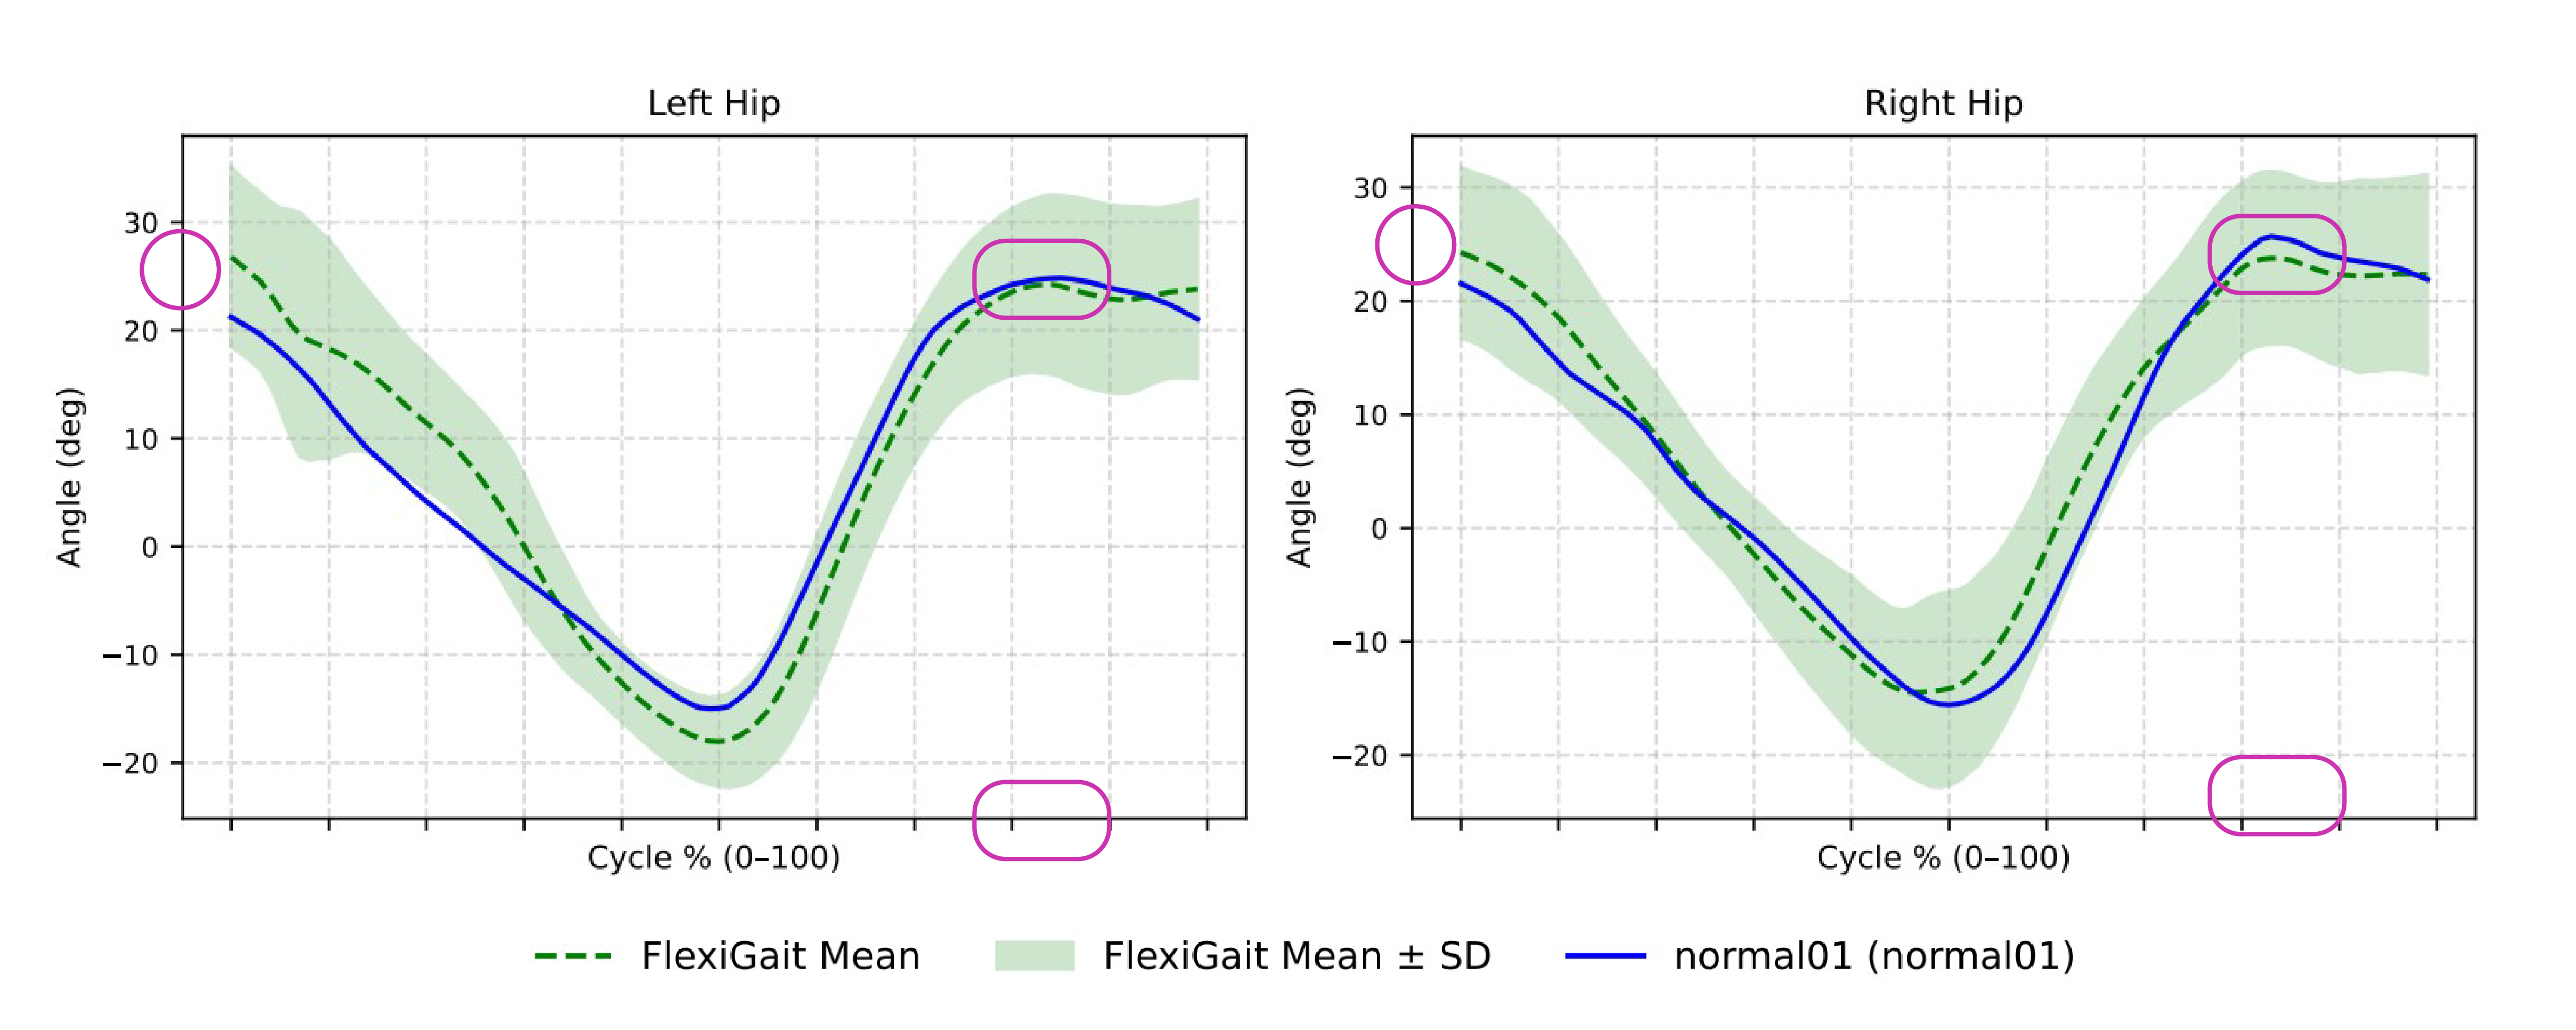
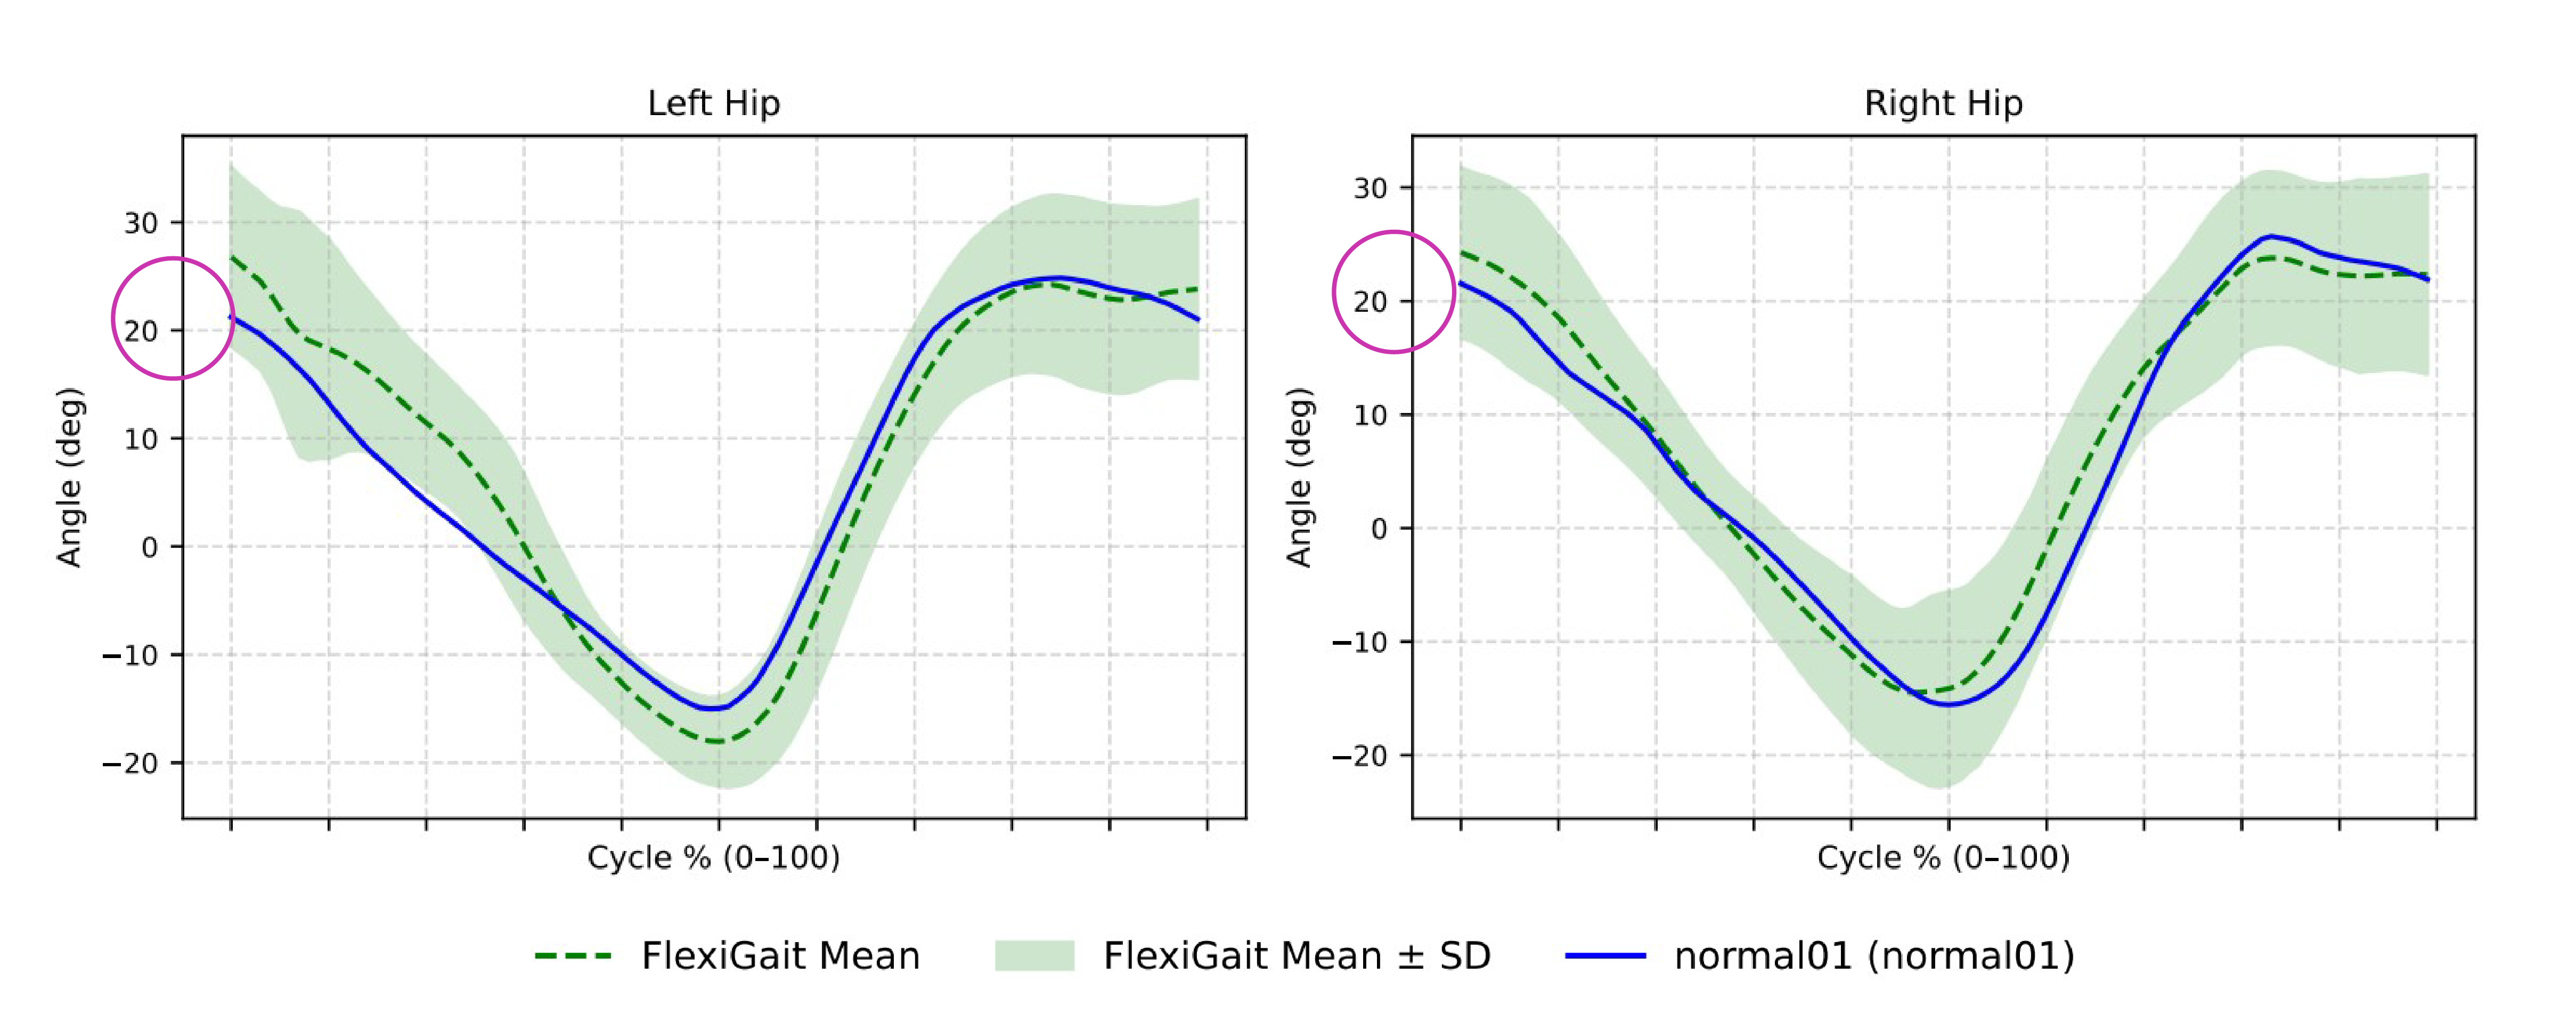
7. The value of the hip angle at the start of the cycle: the value of this angle in different periods of walking is about 20 degrees.
8. Symmetry of left and right leg and range of motion of joints
In conclusion, treadmill gait analysis using tools like FlexiTrace provides valuable insights into human movement. By examining parameters such as maximum and minimum joint angles (hip, knee, and ankle) during different phases of the gait cycle, therapists and rehabilitation specialists can objectively assess movement patterns, identify asymmetries between limbs, and quantify the range of motion. This data-driven approach allows for the development of targeted interventions and personalized exercise programs to improve gait, address injuries, and enhance athletic performance. The specific examples provided, like knee and hip angle variations throughout the gait cycle, illustrate how these parameters can be used to understand and optimize movement.
[Previous: Gait Analysis Methods]
FlexiTrace Offers AI-powered Gait and Posture Analysis

