Introduction
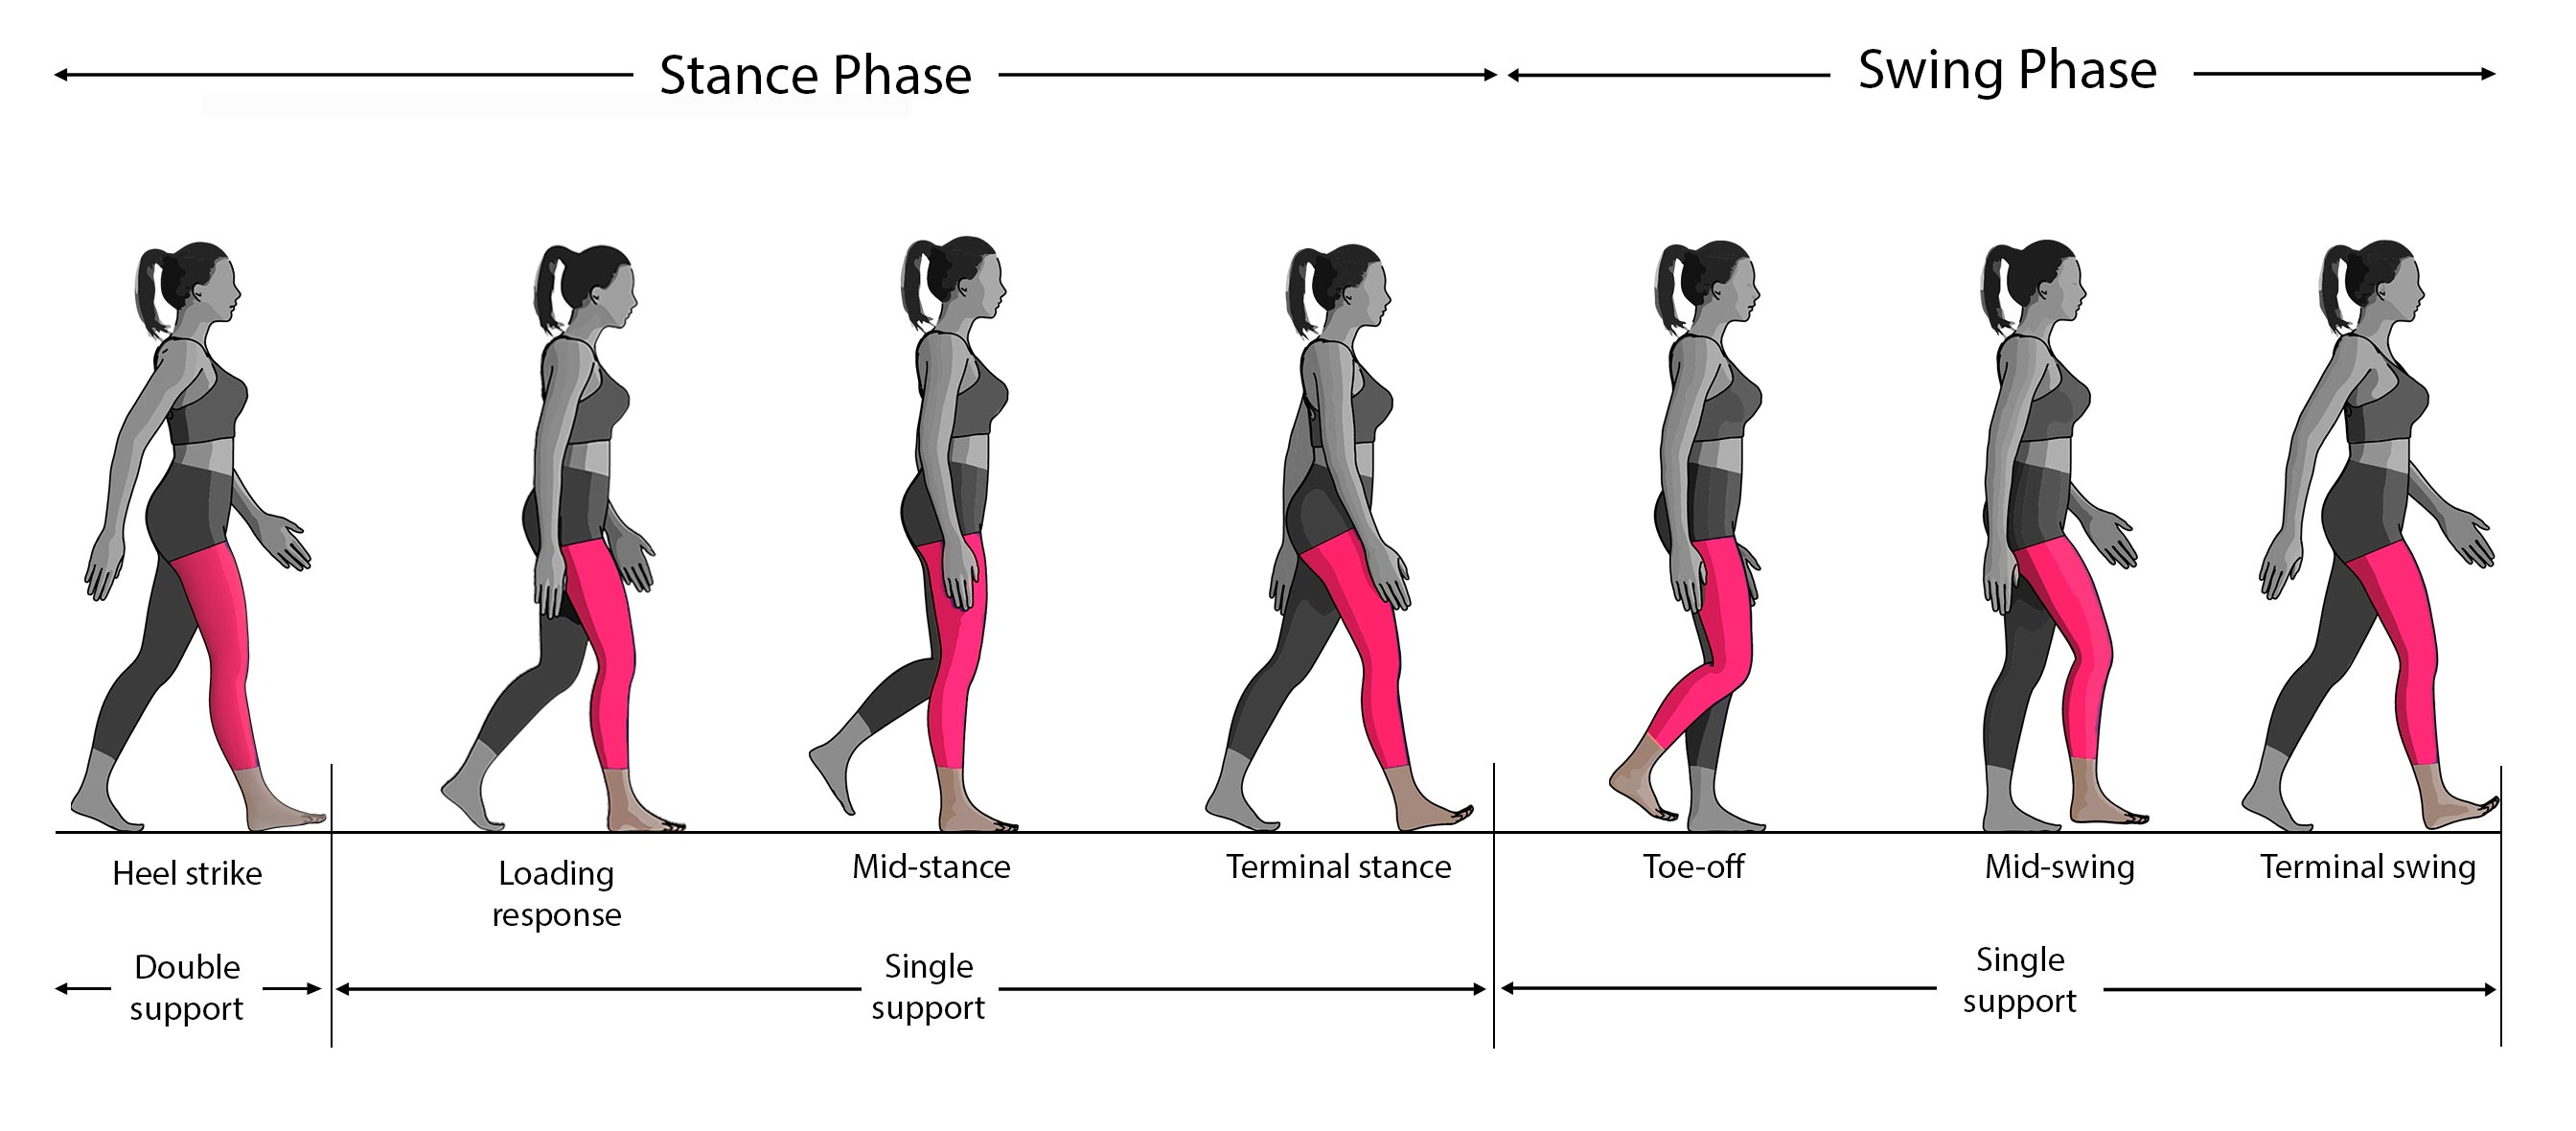
Gait analysis is a scientific method of evaluating movement patterns, kinesiology and examining the range of joint movement and muscle function during walking. Gait analysis is used to assess, plan, and improve the movement patterns of people with disabilities. Rehabilitation movement specialists and physiotherapists use this method to analyze the movements of professional athletes and their injured clients. This type of kinesiology can be effective for analyzing injuries in the skeletal and muscular structure, and professional experts can prepare more suitable movement programs and exercises for their clients.
Gait Analysis Methods
Gait analysis, though sometimes done through simple observation, can now be done with the help of advanced technology. By analyzing the data provided by several models of wearable devices and sensors, it is possible to evaluate the patient's gait in terms of stride length, stride length, speed, cycle time and joint angles.
1. Visual Analysis (current method in clinics):
This gait analysis method is the simplest form of gait analysis and does not require any tools or equipment. The doctor asks the patient to walk on a track for a few minutes and tries to identify abnormal walking patterns using visual observation.
Challenges and limitations of visual analysis
Visual gait analysis has many challenges and limitations. The human eye is unable to accurately detect high-speed movements, and key variables such as cadence and joint angles cannot be assessed without accurate measurement tools. In addition, the lack of a permanent record of walking patterns makes it difficult to track patients' progress. This type of analysis requires high clinical skills, and its accuracy largely depends on the experience and knowledge of experts, which can lead to differences in the evaluation of movement measures.
2. Analysis Equipped laboratories
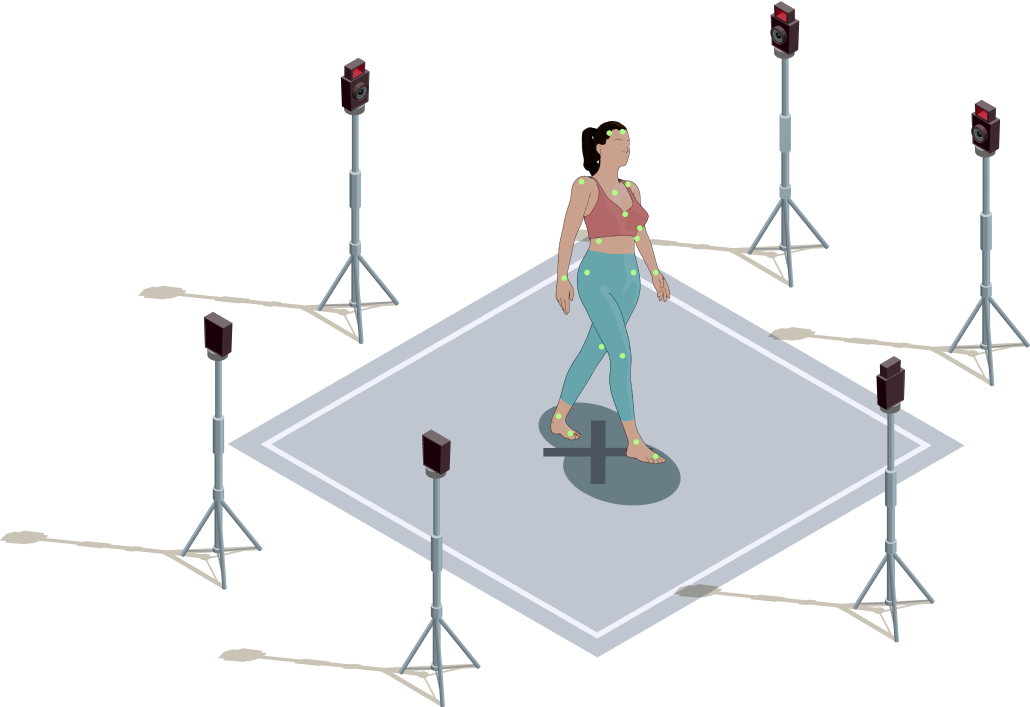
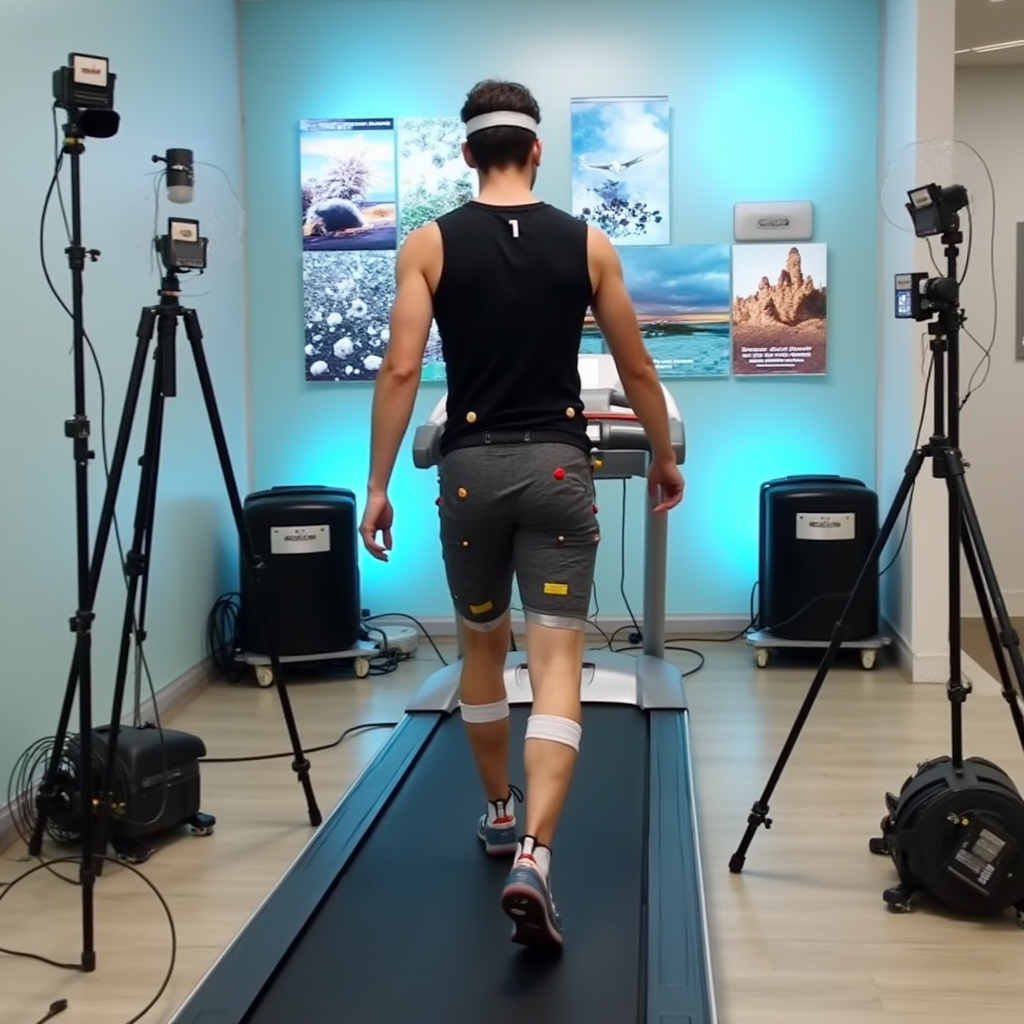
In laboratories equipped with motion analysis, advanced technologies are used to accurately examine motion patterns. Advanced video cameras are able to record movement in slow motion, and with the help of markers that are placed on the body, it is possible to closely monitor movements. In addition, sensors embedded on special platforms measure pressure, step length and stride. To check muscle activity, electrodes are placed on the body to record muscle movements. Also, infrared markers are used to measure joint movement in three dimensions, which significantly increases the accuracy of the analysis.


Challenges and limitations of laboratory methods
Expensive and unavailable equipment
Current laboratory methods require specialized cameras, complex software, and expensive pressure platforms, making their widespread use impractical. In addition to the cost of the equipment, the cost of this analysis for users in America is about 600 dollars.
Discomfort and awkwardness in use
Using electrodes, wearable sensors and skin markers for a long time is uncomfortable and impractical for groups with special disabilities because it is not possible to transfer them to laboratory environments.
Time consuming setup
Correct placement of sensors and markers requires a lot of precision and time, which reduces productivity and makes routine assessments difficult.
Limitations in real-world applications and dependence on fixed environments
These methods are unable to capture natural walking patterns in real environments, as they are usually limited to laboratories. Motion analysis under controlled conditions on a specific platform does not provide close information of how people move in daily life, which reduces the accuracy and applicability of the results.
Gait analysis using FlexiGait:
FlexiTrace is an artificial intelligence-based application that provides personalized treadmill walking reports to analyze users' treadmill walking. This program with recording 60 second video Through the smartphone, evaluate the key parameters of walking A comprehensive report It provides the possibility to compare user data with standard data.
Using a smartphone has many advantages Easy access sentence، Being affordable، Privacy and data security، Ease of use, and Ability to track progress and history brings Application FlexiTrace Taking advantage of these advantages, it allows users to track their walking patterns over time and evaluate its progress.
[Next up: Gait Analysis Methods]
| All Rights Reserved | FlexiTrace Developers LTD